
When troubleshooting UI issues, it is sometimes necessary to obtain additional information about the network requests that are generated in your browser. If this is needed, our support team will ask you to generate a HAR file.
This article describes how to generate a HAR file with each of the major web browsers.
Chrome
- Open Google Chrome and navigate to the page you want to record.
- Right-click on the page, and then click Inspect.
- Click the Network tab.
- Look for the Record button (
 ) in the upper left corner of the frame. It should be red. If the Record button is grey, click it once to start recording.
 - Check the Preserve log box.
- Click the Clear button (
 ). This removes any existing logs from the tab.
 - Reproduce the issue while the network requests are being recorded.
- You will see session output in the frame.
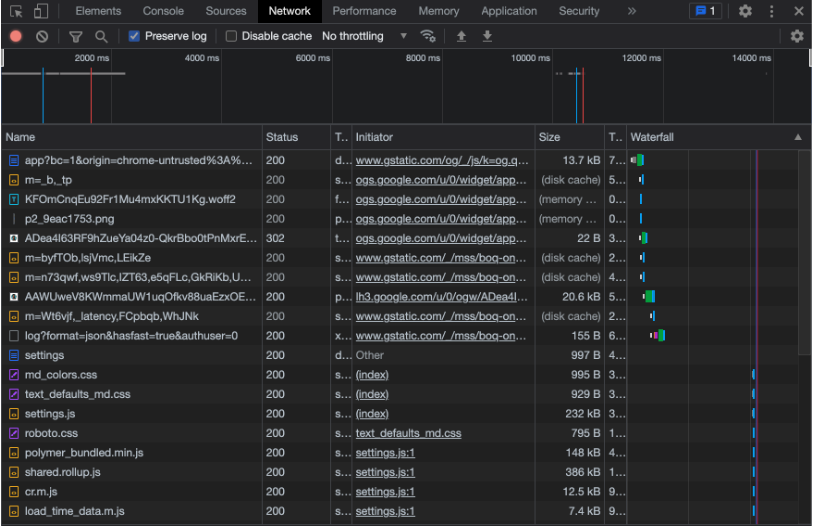
- Once you have reproduced the issue, click the Export HAR button (
 ).
). - You are prompted to save the file on your computer.
- Save the HAR file.
- Attach the HAR file to your ticket.
Edge
- Open Microsoft Edge and navigate to the page you want to record.
- Right-click on the page, and then click Inspect.
- Click the Network tab.
- Look for the Record button (
 ) in the upper left corner of the frame. It should be red. If the Record button is grey, click it once to start recording.
 - Check the Preserve log box.
- Click the Clear button (
 ). This removes any existing logs from the tab.
 - Reproduce the issue while the network requests are being recorded.
- You will see session output in the frame.
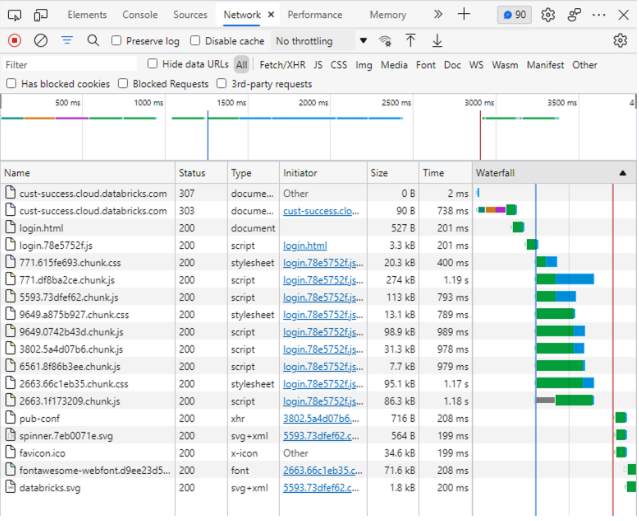
- Once you have reproduced the issue, click the Export HAR button (
 ).
). - You are prompted to save the file on your computer.
- Save the HAR file.
- Attach the HAR file to your ticket.
Firefox
- Open Firefox and navigate to the page you want to record.
- Look for the the Firefox menu in the top-right.
- Click More Tools.
- Click Web Developer Tools.
- The Developer Network Tools panel opens.
- Click the Network tab.
- Start performing actions in the browser. Recording starts automatically.
- Once you have reproduced the issue, right-click on the gear (⚙).
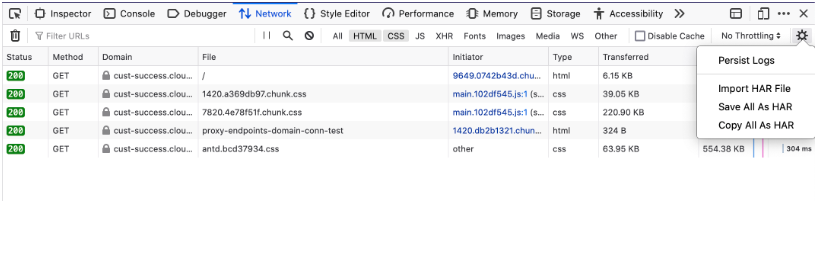
- Click Save all as HAR.
- You are prompted to save the file on your computer.
- Save the HAR file.
- Attach the HAR file to your ticket.
Safari
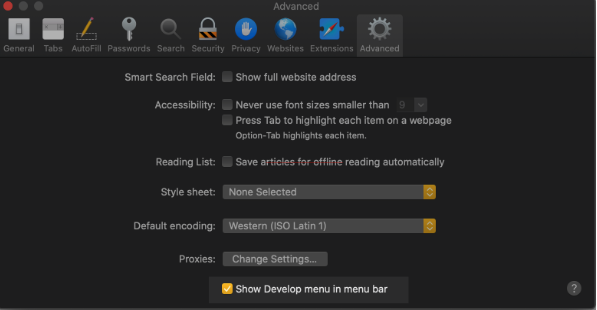
You need to enable the Develop Menu in Safari before you can access the developer console.
- Click Safari in the menu bar
- Click Preferences.
- Click the Advanced tab.
- Select Show Develop menu in menu bar.
- Click Develop in the menu bar.
- Click Show Web Inspector.
- Click the Network tab.
- Start performing actions in the browser. Recording starts automatically.

- Once you have reproduced the issue, click Export.
- You are prompted to save the file on your computer.
- Save the HAR file.
- Attach the HAR file to your ticket.